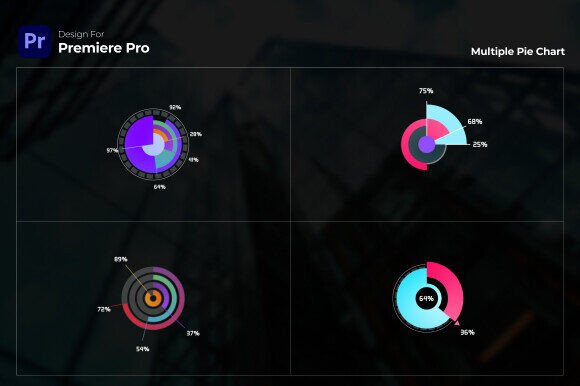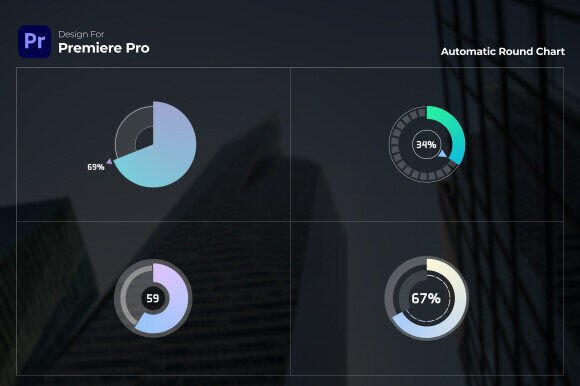
Transform Data with Single Round Chart Premiere Pro
Making numbers feel clear and compelling inside a video isn’t always simple. The Single Round Chart Premiere Pro template changes that. It turns ordinary data points into a smooth, gradient-filled circular graphic that updates automatically as you enter values. Instead of building a chart from scratch or animating every piece manually, you get a ready-made infographic system that lives right inside Premiere Pro. For anyone who needs to present statistics, survey results, budget breakdowns, or performance metrics on screen, this tool removes hours of design guesswork while keeping the final result polished and professional.
What Makes This Premiere Pro Infographic Template Feel Different
When you first open the template, the immediate difference is the way color flows across the chart. The gradient style isn’t just a flat fill—it shifts subtly from one shade to another, giving the graphic a lightweight, modern depth that works well in corporate videos, social clips, and educational content alike. But aesthetics alone don’t explain its usefulness. The real strength comes from a few carefully chosen features that work together to save time and reduce mistakes.
- Gradient color design – adds visual sophistication without extra keyframes.
- Auto value calculation – enter data and the chart redraws itself accurately.
- User-friendly controls – minimal learning curve for beginners, yet flexible enough for experienced editors.
- Free font link included – no need to hunt for matching typefaces.
- Full HD 1920x1080 resolution – crisp output for modern displays.
- No plugins required – works natively in Premiere Pro CC 2023 and above.
Because everything is self-contained, you don’t risk breaking the graph when updating text or adjusting colors. The template manages the transitions, the proportions, and the rounding logic, so you can focus on what the numbers actually mean.
Why Different Audiences Pay Attention to the Same Chart Tool
A small business owner preparing a quarterly update cares about one thing: can they finish the video before lunch? A freelance motion designer wants to know if they can completely recolor the gradient to match a client’s brand palette. A teacher building a lesson might simply want the chart to be readable on a projector. The Single Round Chart Premiere Pro template meets these varied needs not by being complicated, but by keeping its foundation simple and its customization open.
Busy Marketers and Social Media Creators
Speed often decides whether a campaign asset gets published or abandoned. Marketers appreciate that the auto value calculation means they can drop in fresh numbers—perhaps this week’s conversion rates or follower growth—and render a clean animated chart within minutes. There is no rebuilding from scratch. The gradient finish also feels native to modern social feeds where flat, harsh graphics can look out of place. For a creator juggling multiple platforms, that combination of speed and visual appeal makes the template a dependable part of their production routine.
Video Editors Who Want Reliability Without Bloat
Veteran editors often resist templates that overpromise. They need something that integrates smoothly into an existing timeline without breaking. Here, the lack of required plugins and the compatibility with Premiere Pro CC 2023 and above remove common friction points. The template behaves like a well-organized MOGRT file; drop it in, open the Essential Graphics panel, and everything is labelled clearly. Even if an editor plans to heavily modify the chart—changing the ring thickness, swapping the gradient endpoints, or adding their own background—starting from this base is faster than constructing a pie or ring chart with masks and expressions.
Educators and Trainers Who Value Clarity
In educational videos, a graph that distracts or confuses defeats its purpose. The rounded, soft-gradient style helps maintain a calm visual rhythm. The free font link ensures that on-screen labels remain consistent with the rest of the presentation. Because the chart recalculates automatically, an instructor can reuse the same template across multiple lessons, updating only the percentages each time. This repeatability turns a one-time design asset into a long-term teaching aid, which is especially helpful for educators who produce content regularly but have limited design support.
How Auto Value Calculation Reduces the Anxiety Around Data
One of the quiet frustrations in video editing is manually aligning chart slices so that 27% actually looks like 27%. Even a small misalignment can make data feel untrustworthy. The auto value calculation inside the Single Round Chart Premiere Pro template eliminates that worry. You type a number, and the graphic engine distributes the arc segments precisely. This matters equally whether you’re a beginner who isn’t sure how to set up mathematical relationships in After Effects, or a professional who simply wants to avoid tedious manual keyframing when a deadline looms.
Consider a marketing consultant assembling a proposal video. They have six data points representing market share. With the auto calculation, they test different scenarios by tweaking numbers, instantly seeing how the round chart adjusts. No waiting, no double-checking geometry. For a content creator showing monthly income streams, the same feature makes it possible to update a recurring series template within seconds each month, keeping the visual language identical while the numbers evolve.
Customizing the Gradient Style to Match Your Message
The word “gradient” can sometimes suggest a generic Instagram filter, but here it serves a more practical role. Color transitions can highlight a hierarchy—darker at the base to lighter at the edge, or a brand’s primary color blending into a complementary tone. The template doesn’t lock you into a single palette. You can adjust gradient stops, brightness, and saturation within Premiere Pro’s control panel, meaning the same chart can feel corporate in blue and teal for an annual report, then shift to warm orange and peach for a lifestyle vlog.
For small business owners who may not have a dedicated brand kit yet, the included gradient suggestions provide a safe starting point that looks considered, not random. For those with strict brand guidelines, the ability to match exact hex values (by aligning colors through the Essential Graphics panel) ensures the final video stays on-brand. This level of control matters because a data chart often sits at the center of the frame—it becomes the slide’s focal point, and getting the color wrong can undermine the perceived professionalism of the entire video.
Practical Scenarios Where the Template Saves Genuine Effort
It’s one thing to describe features; it’s another to see where they fit into real projects. Here are a few examples that show how different people might thread the Single Round Chart Premiere Pro into their workflow.
- The quarterly investor update: A small accounting firm records a five-minute summary video. They use three instances of the round chart to show revenue split, expense breakdown, and client retention. The auto calculation means the lead accountant simply gives the video editor the latest spreadsheet, and the edits happen in under ten minutes.
- The YouTube explainer series: A science communicator produces a video about energy sources. They customize the gradient to mimic a heat map, use the chart for percentage breakdowns, and pair it with voiceover. The template’s clean aesthetic matches their on-brand minimalism, and they reuse the same MOGRT in future episodes for consistency.
- The classroom recap: A history teacher creates a short recap video with survey results from their class. Since they are not a video professional, the user-friendly panel means they don’t have to learn complex animation. They change the numbers, keep the default gradient (which looks engaging on a smartboard), and export.
- The freelance pitch: A freelance videographer includes the chart in a portfolio sample for a potential client. Because the template is fully customizable, they shift the colors to match the prospect’s logo before sending the sample, demonstrating both data visualization skill and adaptability.
Fitting the Tool to Your Skill Level and Project Needs
Not every video needs a round chart, and not every round chart needs to be built from a template. Determining whether this asset aligns with your work often comes down to a few honest questions. If you rarely use data in your videos, you might not pull it from your library often. But if you frequently include percentages, allocations, or survey results—even once a month—the time saved accumulates quickly.
Beginners should weigh how much they value guided simplicity. The template’s structure means you won’t need to understand expressions, rigging, or keyframe graph editors. The essential controls are text fields and color pickers. That can build confidence, especially for someone who wants to upgrade their video’s information design without a steep learning curve. On the other hand, experienced motion designers might use the template as a starting point that handles the math, then they layer additional animations, camera moves, or overlays around it. The fact that it’s fully customizable and doesn’t rely on locked artwork gives them room to experiment.
Cost-conscious users will note that there’s no requirement to buy additional plugins or premium fonts; the font link leads to a free resource, keeping the total expense predictable. This is meaningful for freelancers, educators, and small teams operating on tight budgets. The technical requirement is simply a recent version of Premiere Pro, which is already part of many creators’ toolkits.
Working Smoothly in Full HD Without Complicated Setups
The 1920x1080 resolution matches the most common delivery standard for YouTube, Vimeo, corporate intranets, and classroom screens. There’s no upscaling fuzziness or need to reinterpret chart spacing for different frame sizes. When you export, the gradient edges remain smooth, and the text—linked to those free fonts—stays readable. This reliability means you don’t have to run test exports at multiple resolutions just to check the chart’s integrity; what you see in the program monitor is what you get.
Long-Term Value and Reusability
A good infographic template doesn’t just serve one project. It becomes a repeatable asset. The auto value calculation ensures that six months from now, when you open an old project file, you can still update the numbers without remembering a complex setup. The clean, gradient-driven design also ages well because it avoids overly trendy effects that might date your content. While visual fashions shift, a well-composed round chart with balanced colors tends to remain useful across years of annual reports, recurring series, and client deliverables.
For those who create tutorial content, the template can even become part of a larger toolkit. Once you understand how the chart MOGRT behaves, you can teach others within your team to update figures without touching the timeline directly. This makes it easier to delegate repetitive tasks while you concentrate on storytelling, pacing, and higher-level edit decisions.
Ultimately, the Single Round Chart Premiere Pro template earns its place by solving a specific, common problem: turning raw numbers into smooth, trustworthy motion graphics without adding friction. Whether you sit down to produce an investor update, an educational module, a marketing snippet, or a personal project, having a dependable chart that calculates itself and looks refined can shift your energy from troubleshooting graphics to communicating ideas. And that’s where the real value lives.