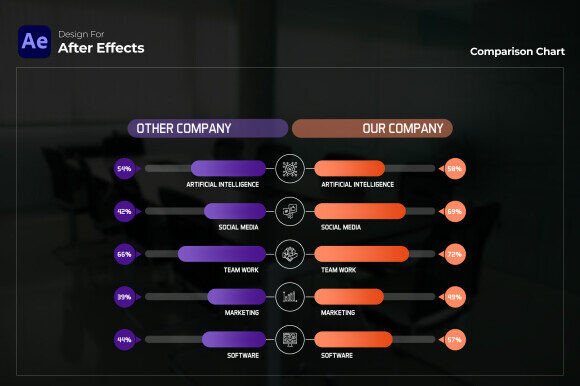
Comparison Chart After Effects: Bringing Data to Life with Motion
When a slide deck filled with static numbers and bullet points no longer holds an audience’s attention, motion graphics step in to change the conversation. A Comparison Chart After Effects template – often delivered as a MOGRT file for Premiere Pro – is precisely that missing link. It transforms dry feature tables and performance metrics into animated, side-by-side visual stories that feel immediate and trustworthy. Rather than just telling someone that option A outperforms option B, you show it with a smooth color transition, a subtle reveal, or a gradient that shifts from green to red in real time.
This isn’t about adding flash for the sake of it. Teams inside marketing departments, creative studios, and corporate communications are rethinking how they share internal reports and client-facing deliverables. Modern audiences expect clarity, speed, and a sense of production value that mirrors the platforms they consume daily – short video updates, social media explainers, or reels that pack complex comparisons into a few seconds. A well-chosen template makes that possible without starting from scratch or hiring a dedicated motion designer for every project.
Why Static Comparisons Fall Short in Today’s Workflows
Think about the last time you opened a lengthy PDF report on your phone. Did you scroll past table after table, or did you skip to a concise summary? The shift to mobile-first consumption and asynchronous work has fundamentally changed how information is absorbed. Static charts, while still useful for archival documents, rarely communicate priority or urgency. In a video-first landscape, an animated comparison chart does the heavy lifting: it can sequence information, highlight the most salient data point, and guide the viewer’s eye exactly where you need it to go.
This aligns with what cognitive researchers often call the “picture superiority effect” – the idea that moving, color-coded visuals are remembered more reliably than text alone. When a Comparison Chart After Effects template lets you animate bars climbing up or columns flipping, the comparison becomes experiential. A business analyst presenting quarterly sales figures or a product marketer explaining feature differences can now center the narrative on the moment of contrast, rather than expecting the audience to scan a spreadsheet. It’s a subtle but powerful shift from passive reporting to active storytelling.
The Evolution of Data Presentation: From Boardroom to Video Stream
Fifteen years ago, motion graphics for business data were reserved for big-budget product launches or broadcast commercials. Creating a simple animated comparison meant working in After Effects, which required a steep learning curve and time that most in-house teams didn’t have. Today, template ecosystems have matured. You no longer need to build a chart rig from scratch. Robust, fully customizable files – compatible with Premiere Pro CC 2023 and above – bring the same polished look within reach of video editors, content creators, and even educators who have moderate technical skills.
What’s driving this attention is not just easier access to tools, but a broader expectation that data should be interesting to look at. The rise of data journalism, interactive annual reports, and social media infographics has trained viewers to expect a visual hook. A motion graphic template that offers customizable gradients, such as sleek green and red designs for positive versus negative comparisons, instantly answers that expectation. It signals that the presenter respects the audience’s time and intelligence – no decoding of raw tables required. Red means a drop, green means growth; the gradient communicates an emotional layer that plain text cannot.
Inside a Modern Comparison Chart Template: Features That Simplify Your Work
Not all template packs are created equal, but the most effective ones share a common philosophy: they remove friction while preserving flexibility. The description of this particular Comparison Chart After Effects resource highlights several practical components that are worth examining because they reflect what professionals actually need during crunch time.
- Customizable Gradients – The thoughtful use of green and red gradients does more than look modern. It taps into a universal color language. When a value tilts positive, the green deepens; when negative, the red becomes more pronounced. This visual cue works across cultures and industries, making the template suitable for product comparisons, candidate evaluations, or financial summaries without requiring extensive design overhauls.
- Diverse Chart Styles – A single layout rarely fits every story. The inclusion of multiple chart formats – side-by-side product comparisons, multi-column performance analyses, and head-to-head evaluations – covers the most common business scenarios. You might use one style for a competitor feature matrix and another for an internal team review. Having these variations in one package means visual consistency across an entire video or campaign without forcing a square peg into a round hole.
- Editable Text and Values – This sounds obvious, but the real benefit is in the workflow. You can open the template inside Premiere Pro’s Essential Graphics panel, type new numbers directly, adjust labels, and tweak descriptive captions without ever opening After Effects. This means a marketing coordinator can update figures for a weekly report video in minutes, not hours.
- High-Quality Design – Clean lines, balanced composition, and Full HD 1920×1080 resolution ensure the output looks crisp on large conference screens and mobile devices alike. The professional finish adds credibility, whether the video is for an annual report or a crowdfunding campaign pitch.
- User-Friendly Experience – Even beginners can open the project, swap out placeholder content, and render a usable clip. The learning curve is intentionally low, which democratizes motion design inside small teams and solo operations.
- Free Font Link Provided – This small detail eliminates a common frustration. Instead of hunting for the exact typeface used in the preview, you access a direct link and install it, preserving the intended typographic rhythm.
- No Plugins Required – A plugin-free build means fewer compatibility headaches, faster load times, and seamless sharing between team members. It’s a purely native workflow that respects the host application’s core capabilities.
Collectively, these features answer a very real demand: produce more with less, maintain a professional edge, and never miss a deadline because a chart animation took too long to build.
Practical Use Cases Where Motion Comparisons Shine
To appreciate the relevance, it helps to picture real-world scenarios. A product manager preparing a launch video for an e-commerce platform can use a Comparison Chart After Effects template to visually compare the new device against three top competitors on battery life, screen size, and price. Instead of a static slide that viewers might ignore after two seconds, the animated bars pop up one after another, ending with a subtle glow on the winner. That small piece of motion keeps attention fixed and makes the advantage memorable.
In the education space, instructors building online courses often struggle to present contrasting theories or historical data in a way that holds students’ attention across a 15-minute lecture video. An animated comparison chart breaks the monotony. A history teacher comparing economic growth rates across decades can let the figures rise with color-coded arrows, while a science communicator evaluating two climate models can use the template’s clean layout to separate myth from evidence. The result is higher engagement and better retention, with minimal extra editing effort.
HR departments and recruiters are another unexpected beneficiary. Candidate evaluation videos, while less common, are gaining traction in internal hiring presentations and onboarding summaries. Showing a quick side-by-side breakdown of soft skills, experience levels, and certification matches using a motion graphic injects fairness and transparency into the process. The red-green gradient system can even be adapted to indicate missing qualifications or standout traits, making the decision-making visual and collaborative.
For freelancers and agencies managing client expectations, such a template becomes a reusable asset. Once you’ve customized a chart style for a quarterly marketing report, you can duplicate the project file, update the numbers for the next quarter, and deliver a consistent branded experience. Clients notice that continuity, and it reduces the per-project cost of high-quality animation significantly.
Aligning with Broader Content and Design Trends
The growing popularity of motion-based comparison charts isn’t happening in isolation. It connects directly to the surge of short-form video on platforms where quick, digestible data bites perform exceptionally well. A 30-second reel comparing two software tools side by side, completely built from a Comparison Chart After Effects template, can generate more engagement than a long blog post. Marketers are repurposing these animations into multiple formats – square for LinkedIn, vertical for Instagram Stories, widescreen for YouTube – all from the same Full HD template, which scales gracefully.
At the same time, the corporate world’s embrace of asynchronous communication has elevated the internal video update. Remote and hybrid teams rely on recorded presentations to share results and strategy. When a team lead drops a quick Loom or Vimeo link into Slack, a motion graphic chart conveys diligence and clarity. It signals that the data wasn’t just thrown together; it was curated and designed to be understood quickly, no real-time explanation needed.
Design trends also favor minimalism with intentional color pop. The sleek green-and-red gradient approach fits perfectly into that aesthetic without feeling gimmicky. It also meets accessibility considerations better than low-contrast static PNGs because motion and color change draw the eye to key differences, helping viewers who might otherwise skim over critical disparities.
How to Make the Most of a Comparison Chart Template
Owning a powerful template is step one; using it well is step two. A common mistake is overloading a single comparison with too many data points. Motion graphics work best when they showcase the most important contrasts, not every conceivable metric. Start by identifying the top three to five items your audience actually cares about. Then let the template’s built-in animation do the pacing: reveal one comparison at a time, allow a moment for the viewer to process the green or red gradient, and let the conclusion land.
Pay attention to font accessibility. The free font link ensures you have the correct typeface, but also test legibility at small sizes if you plan to export for mobile-first consumption. A clean sans-serif with sufficient weight works universally. Adjustable text values inside the Essential Graphics panel mean you can experiment with font size and contrast without leaving Premiere Pro.
Experiment with the diverse chart styles included. If you are comparing products, the side-by-side columns might work best. For performance analysis over time, a split-screen timeline approach may tell a clearer story. Rotating the style also keeps regular content fresh; a marketing report that uses the same layout every month risks becoming invisible. Swapping between the included variations, while keeping the brand colors consistent, maintains professionalism and viewer interest.
Who Benefits Most from This Approach
While the use cases are broad, certain professionals stand to gain the most immediate value. Small business owners who run their own social media and client education can transform a pricing comparison into a trust-building video without needing a video agency. Business presenters inside large organizations can move beyond the limitations of slideware and embed animated charts directly into conference recaps or stakeholder updates. Educators and instructional designers get a flexible tool to simplify difficult “versus” topics, from literary character comparisons to engineering material properties.
Marketing teams, in particular, find motion-based comparison charts useful for retargeting campaigns, where a quick, punchy video showing feature superiority can nudge a warm lead toward a purchase. Event organizers use them for sponsor highlight reels. Nonprofits adopt them to compare program outcomes year over year, making donor communications more compelling. In each case, the underlying need is the same: convey difference and significance quickly, beautifully, and accurately.
The accessibility of a Comparison Chart After Effects workflow, compatible with Premiere Pro 2023 and later, with no plugins required, means that even organizations with lightweight tech stacks can participate. A marketing coordinator with basic video editing knowledge can open the template, edit text and values, and render a 1080p clip that looks as though it was custom-built by a motion designer.
Maintaining Longevity in a Rapidly Shifting Media Environment
One concern with templates is that they might quickly look dated. However, a well-structured comparison chart template based on clean geometry and typography has a longer shelf life than effect-heavy motion graphics. The key is its customization capacity. As brand guidelines evolve, you can adjust the gradient colors beyond the default green and red. You can replace the background, tweak animation speed, or even combine multiple chart styles into a single cohesive story. Because it’s fully customizable at a fundamental level, the template adapts rather than expires.
Furthermore, the demand for clear data communication isn’t going away. If anything, the influx of AI-generated text and data makes human-crafted visual comparisons more valuable. A hand-edited chart that highlights a specific business insight with a tailored gradient carries a credibility that generic auto-generated charts often lack. The time saved by a user-friendly template doesn’t diminish the personal touch; it frees up mental energy to focus on the strategic message, not the technical grind of keyframes.
In that sense, investing a little time today in mastering a quality comparison chart motion graphic resource pays off across countless future presentations, reports, and marketing assets. It becomes part of your visual vocabulary, ready to deploy whenever you need to turn raw numbers into a persuasive, data-driven narrative that moves – literally and figuratively.